Frequently Asked Questions
A calculation of value report is $997.00. A minority discount letter (to determine the value of a minority interest) is an additional $270.00. Additional analysis can be performed at the rate of $270.00.
How we determine the value of your company:
In most cases, we use the highest outcome of three standard approaches: the Income Approach, the Market Approach, and the Asset Approach.
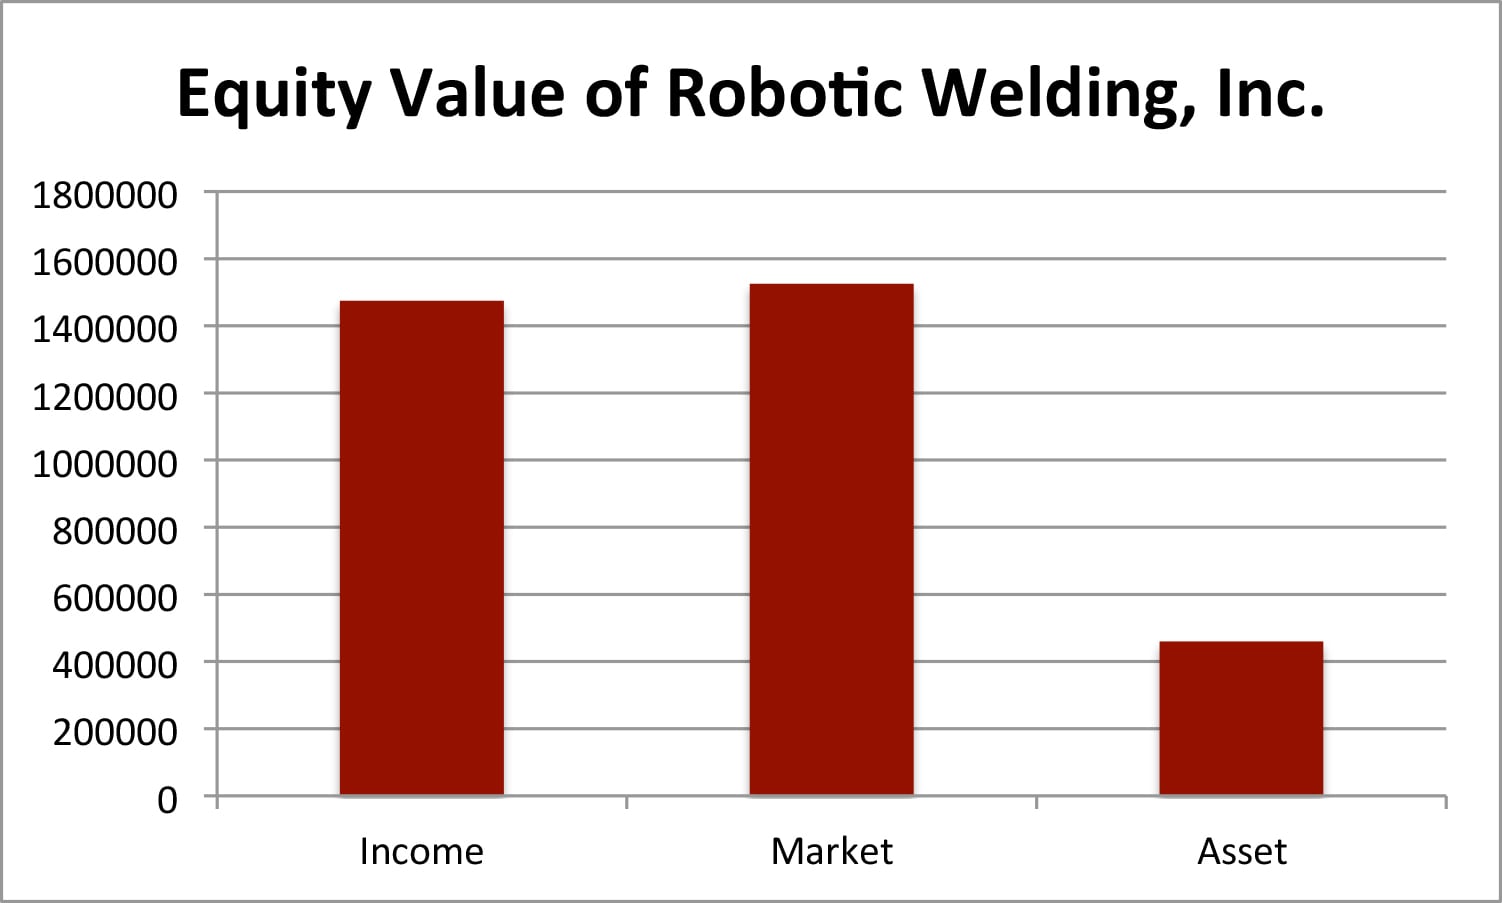
The Income Approach
The Income Approach values your company based on the present value of all future expected earnings. First, we determine the appropriate amount of annual earnings an investor would expect to receive from your business, then we determine the appropriate required rate of return, and then discount the future earnings to present day value. In determining the rate of return, we consider many factors, including: industry, size, balance sheet quality, customer concentration, growth expectations, etc.
The Market Approach
In the Market Approach, we collect data from companies in the same industry and size range as your company which have recently sold. We compute means and medians of the Price/Sales ratios and Price/Operating Income ratios from the companies in the group. Then we apply those ratios to your company's data to determine its value based on those previous transactions.
The Asset Approach
The Asset Approach usually establishes a minimum value for your company. It is based on the approximate fair market value of your company's tangible and financial assets. It does not account for the potential goodwill value of your business created by it's sales history or income producing capacity.
All of the values arrived at by these methods are adjusted for working capital (current assets less current liabilities), excess assets (assets not needed to produce income) and long term liabilities. The result is the value of the equity in your company. See our SAMPLE BUSINESS VALUATION REPORT for a more detailed explanation.
About the Reliability Score

The Reliability Score (August 31, 2017)
If we could see the future, and know exactly what your business’s future sales, profitability, and selling price would be, we could calculate its true value to you today with terrific precision. Unfortunately we cannot. Business valuations must be based on estimates of future activity derived from past data.
Potential variances do not generally occur out of error. Variances occur when accurate data from the past creates expectations for the future that do not prove true. Of course, these kinds of variations occur everywhere. Past data may indicate that your business will continue to grow at 5% per year, but in reality it may grow at over 10%, or only 2%. Your profitability will inevitably be higher or lower than what is projected in our model.
The important question is "By how much?" By determining the variance potential of the many data inputs we use to calculate your business value (such as sales, growth rate, profitability, etc.) we can determine the impact all the over-lapping variation has on your business value. This allows us to determine the potential variation contained within your business value estimate, and even identify the key factors contributing to that variation.
The Reliability Score is the probability that the ‘true value’ will be within 25% higher or lower of the expected value. For example, if the Income Approach produces an expected value of $10,000,000, and the associated Reliability Score is 79, then our analysis indicates there is 79% probability that the true value of the business will be between $7,500,000 and $12,500,000.
The Above Score
The Above Score is the probability that the 'true value' will be above 75% of the expected value. For example, if the value estimate is $10,000,000 and the Above Score is 90, there is a 90% probability that the business value is above $7,500,000.
The Bell Curves
The bell curves that accompany your valuation estimate visually demonstrates its potential variation. They can also demonstrate your potential upside and downside. For example, it may indicate that there is a 10% chance that your business is (or will be found to be) worth more than $12,500,000, and a 10% chance it may be worth less than $7,500,000. The solid areas of the bell curves indicate the probability area that covers 25% above and below the value estimate, and the striped areas (the tails) indicate the probability of the value being less than 75% pf the estimate, or more than 125%.
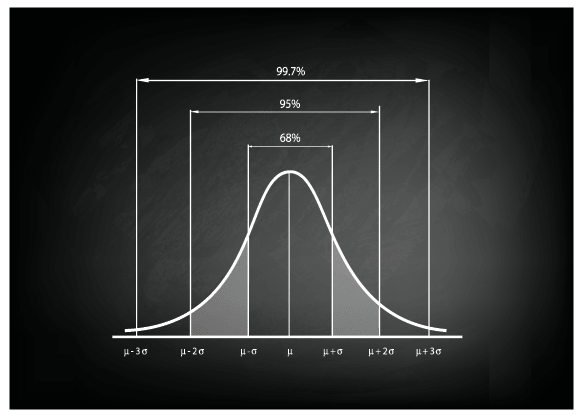
A tall bell curve indicates low variability, and will have a higher Reliability Score. A lower wide bell curve indicates more variability and will have a lower Reliability Score.
Why is the Potential for Variation So High?
There are two primary reasons small business values have so much variation. First, the actual results of business performance is very difficult to accurately project. This is true for big companies, and even more so for small ones.
Second, the ‘market’ for buying and selling small businesses is highly inefficient compared to most other established markets. In efficient markets, reasonable quantities of buyers and sellers bid on goods or services that are relatively homogenous and have predictable value. That efficiency creates consistency in price and valuation methodology. While businesses in a given industry and size range (for example, equipment manufacturers with sales between $5 – 10 million) are relatively homogenous, there is seldom a sufficient quantity of both buyers and sellers to create efficient bidding. Therefore the price paid for similar businesses can vary widely from one transaction to the next.
Brian Murray CPA/ABV, CVA specializes in business valuation, merger and acquisition consulting, and has served as an expert witness in court.
The majority of banks will accept our calculation of value report for SBA loans up to $250,000, and many accept our reports for larger SBA loans. Some banks still require full valuation reports for SBA loans of $250,000 or more.
Full valuation reports are expensive, and take weeks or more to complete. Due to the time requirements of judicial process, if one party in a divorce proceeding orders a full business valuation report, the other party will usually do the same soon after. This can immediately cause the cost of the divorce to increase by $10,000 - $20,000 between both parties. If a low cost calculation of value report is ordered early in the process, one or both parties may realize that the business value does not warrant a full valuation, and the two sides may settle on a value without expert witnesses and unnecessary litigation. In some cases the calculation of value report may indicate that the business value is significant enough that a full valuation report is warranted.
Accuracy is the most important factor for all valuations submitted to the IRS. If the IRS challenges your valuation, they must demonstrate that your valuation logic or methodology is flawed, and present a valuation of their own. The more a business interest is worth, the larger effect its valuation has in determining tax, and the more scrutiny such valuation will receive from the IRS. For business interests worth less than $500,000, a calculation of value report (as sold here) is adequate. For business interests worth more than $1,000,000, a full business valuation report is appropriate. For interests valued between $500,000 and $1,000,000, consideration must be given to the specific circumstances to determining if a full valuation report is warranted. Primary among those considerations is: (1) what are the tax implications of the specific valuation, and (2) were valuation discounts applied to arrive at the value.