About The Reliability Score
The Reliability Score (March 31, 2017)
If we could see the future, and know exactly what your business’s future sales, profitability, and selling price would be, we could calculate its true value to you today with terrific precision. Unfortunately we cannot. Business valuations must be based on estimates of future activity derived from past data.
Potential variances do not generally occur out of error. Variances occur when accurate data from the past creates expectations for the future that do not prove true. Of course, these kinds of variations occur everywhere. Past data may indicate that your business will continue to grow at 5% per year, but in reality it may grow at over 10%, or only 2%. Your profitability will inevitably be higher or lower than what is projected in our model.
The important question is “By how much?” By determining the variance potential of the many data inputs we use to calculate your business value (such as sales, growth rate, profitability, etc.) we can determine the impact all the over-lapping variation has on your business value. This allows us to determine the potential variation contained within your business value estimate, and even identify the key factors contributing to that variation.
The Reliability Score is the probability that the ‘true value’ will be within 25% higher or lower of the expected value. For example, if the Income Approach produces an expected value of $10,000,000, and the associated Reliability Score is 79, then our analysis indicates there is 79% probability that the true value of the business will be between $7,500,000 and $12,500,000
The Above Score
The Above Score is the probability that the 'true value' will be above 75% of the expected value. For example, if the value estimate is $10,000,000 and the Above Score is 90, there is a 90% probability that the business value is above $7,500,000.
The Bell Curves
The bell curves that accompany your valuation estimate visually demonstrates its potential variation. They can also demonstrate your potential upside and downside. For example, it may indicate that there is a 10% chance that your business is (or will be found to be) worth more than $12,500,000, and a 10% chance it may be worth less than $7,500,000. The solid areas of the bell curves indicate the probability area that covers 25% above and below the value estimate, and the striped areas (the tails) indicate the probability of the value being less than 75% pf the estimate, or more than 125%.
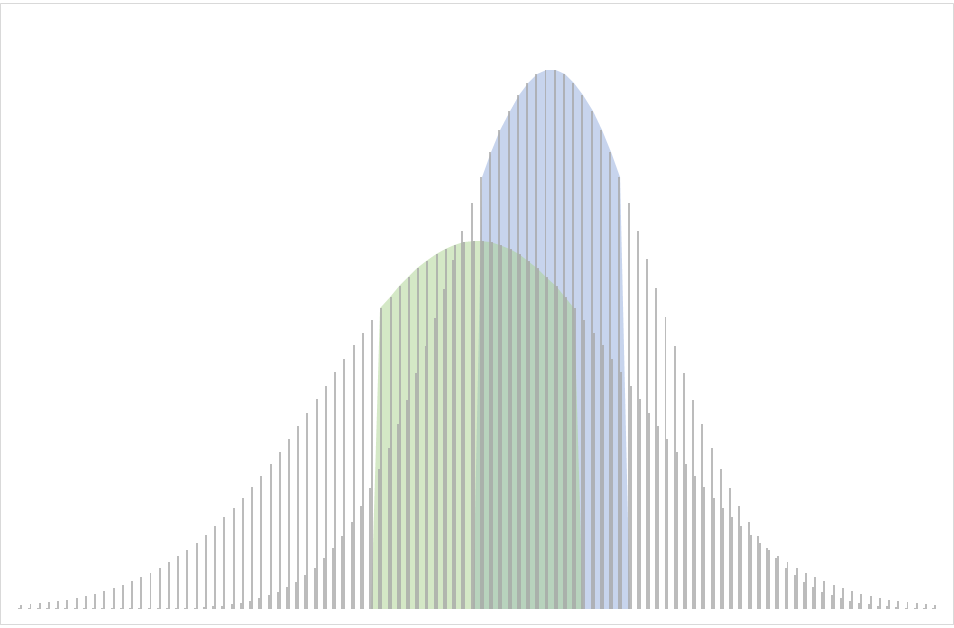
A tall bell curve indicates low variability, and will have a higher Reliability Score. A lower wide bell curve indicates more variability and will have a lower Reliability Score.
Why is the Potential for Variation So High?
There are two primary reasons small business values have so much variation. First, the actual results of business performance is very difficult to accurately project. This is true for big companies, and even more so for small ones.
Second, the ‘market’ for buying and selling small businesses is highly inefficient compared to most other established markets. In efficient markets, reasonable quantities of buyers and sellers bid on goods or services that are relatively homogenous and have predictable value. That efficiency creates consistency in price and valuation methodology. While businesses in a given industry and size range (for example, equipment manufacturers with sales between $5 – 10 million) are relatively homogenous, there is seldom a sufficient quantity of both buyers and sellers to create efficient bidding. Therefore the price paid for similar businesses can vary widely from one transaction to the next.
Brian Murray CPA/ABV, CVA specializes in business valuation, merger and acquisition consulting, and has served as an expert witness in court.

BRIAN MURRAY CPA/ABV CVA
Company founder Brian Murray CPA/ABV, CVA (Accredited in Business Valuation, Certified Valuation Analyst) has been in public accounting since 1997. Prior to that he was in finance at Kimberly-Clark Corp., audit at M&I Bank Corp., and accounting manager at Browning-Ferris Ind. Brian's areas of specialty are estate and trust tax and business valuation.Brian's community involvement includes: serving as Treasurer of the Salvation Army Fox Cities, serving on the Board of Directors of the Fox Valley Humane Society, serving on the Board of Directors of Big Brothers/Big Sisters, serving on the Board of Directors of the Wildwood Film Festival, and serving on the Board of Directors of Mothers and Unborn Baby Care. Brian also volunteered as a Big Brother for four years, and for United Way's fundraising campaign for multiple years. Brian and his family live in Neenah, WI.
Brian has been consulting clients regarding business value and merger & acquisition transactions since 2000. The majority of the valuation reports written were to aid a buyer or seller in a transaction or negotiation. Brian has often served as lead negotiator for prospective buyers or sellers.
Brian has served as an expert witness in corporate litigation cases as well as divorce, and has performed valuations for estate and gift tax returns, and estate planning.