Modeling Operating Income From Historical Data

Using Geometric Analysis in Business Valuation (October 1, 2018)
When preparing business valuations, experts usually begin by projecting sales, then model operating income using the sales projection as a basis (see our article titled “Is There a Better Method of Forecasting Sales?”)
Many valuation experts simply use a historic average operating profit percentage of sales to model future operating profit. This rather unsophisticated approach effectively treats all expenses as variable. While this may be true in the extreme long term, it isn’t true in the five-year term that business valuation is principally concerned with. We must consider the fixed and variable components of the company’s cost structure to accurately project the impact differing sales levels have on operating profit.
Traditionally, this would require an accountant to classify all of the operating expenses on the income statement as either variable or fixed. While this may seem simple, it can be a matter of considerable debate and confusion. For example: advertising. Advertising tends to vary with sales, but does not vary as a direct result of sales. Is it variable or fixed? Further, many expense accounts have both fixed and variable components within them.
Operating labor, for example, may have a fixed component blended with the variable component. If sales dropped sharply at a company, management may choose not to release a commensurate number of workers out of a fear that if or when sales return they will not have adequate time to retrain new operators. In this scenario, some of the operating labor has become fixed in the short run.
Our goal was to develop an analytical method that recognized fixed and variable expense behavior, but did not rely on arbitrary interpretations of expense classifications. We wanted a model derived from the income and expense activity itself. After considerable experimentation, we developed a method using geometry. We call it ‘geometric analysis.’
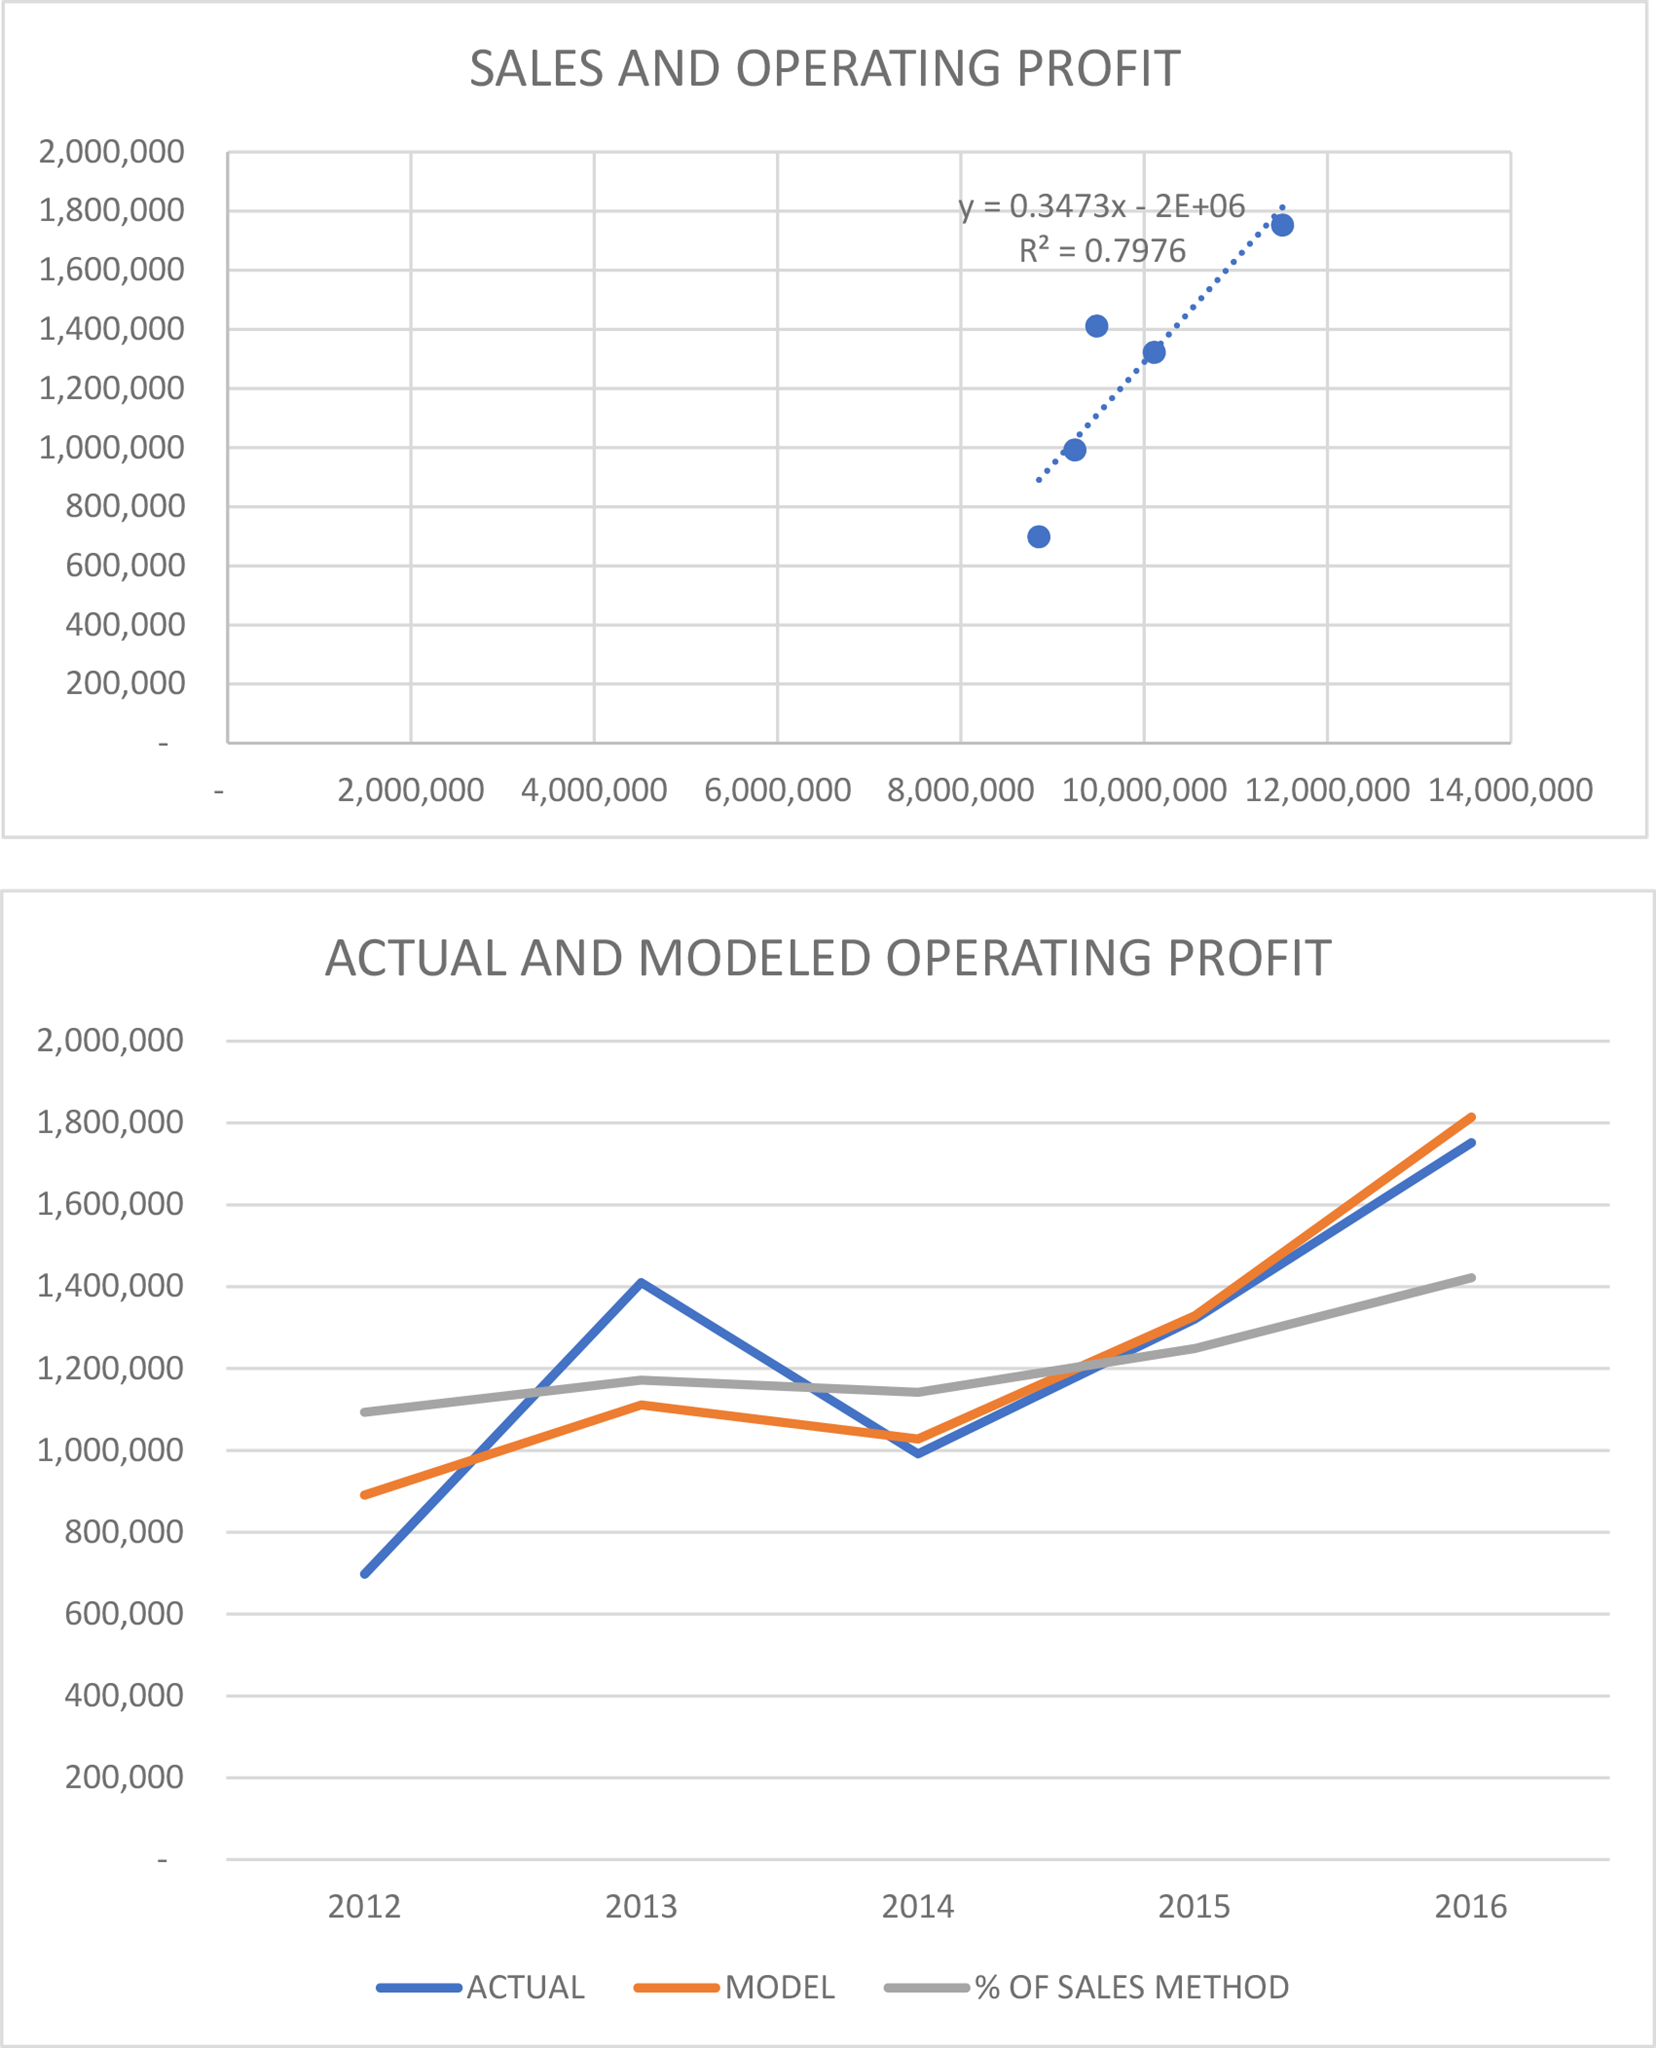
The last five years of sales and operating profit are re-indexed based on sales and are plotted on a graph, where sales is represented on the x axis and operating profit is on the y axis. After plotting these points, a line of best fit (a straight line with the minimum deviation possible from each point) is drawn through the points using the least squares method. One minus the line slope is the variable cost percentage for our model. Negative one times the y intercept is the fixed cost component.
Next, we use the actual sales data for each year to calculate the model profit estimated for that year. We compare these results to the actual operating profits on a graph. The accuracy of the model is often remarkable. We also show the profitability estimated by the percent of sales method as well to visually demonstrate the improved accuracy of our geometrically generated model.

Finally, we apply our model to the projected future sales for the next five years to generate our forward-looking projection of operating profit.
If you would like to experiment with the operating profit model we have developed, click this operating profit model link.
Brian Murray CPA/ABV, CVA specializes in business valuation, merger and acquisition consulting, and has served as an expert witness in court.

BRIAN MURRAY CPA/ABV CVA
Company founder Brian Murray CPA/ABV, CVA (Accredited in Business Valuation, Certified Valuation Analyst) has been in public accounting since 1997. Prior to that he was in finance at Kimberly-Clark Corp., audit at M&I Bank Corp., and accounting manager at Browning-Ferris Ind. Brian's areas of specialty are estate and trust tax and business valuation.Brian's community involvement includes: serving as Treasurer of the Salvation Army Fox Cities, serving on the Board of Directors of the Fox Valley Humane Society, serving on the Board of Directors of Big Brothers/Big Sisters, serving on the Board of Directors of the Wildwood Film Festival, and serving on the Board of Directors of Mothers and Unborn Baby Care. Brian also volunteered as a Big Brother for four years, and for United Way's fundraising campaign for multiple years. Brian and his family live in Neenah, WI.
Brian has been consulting clients regarding business value and merger & acquisition transactions since 2000. The majority of the valuation reports written were to aid a buyer or seller in a transaction or negotiation. Brian has often served as lead negotiator for prospective buyers or sellers.
Brian has served as an expert witness in corporate litigation cases as well as divorce, and has performed valuations for estate and gift tax returns, and estate planning.
